Elevate Your Trading with Precision
Discover our advanced trading strategies designed to optimize your market performance. From automated execution to dynamic trend analysis, our strategies provide the edge you need to trade with confidence and stay ahead of the market.


Maximize Your Trading Edge
Automated Trading Strategies
Stay ahead of the game with our strategy's real-time market analysis capabilities. It continuously scans the market, identifying trading setups and making rapid trading decisions.
- Superior Performance
-
Our automated strategy harnesses the power of advanced algorithms to deliver exceptional performance in NQ and MNQ futures trading. Capitalize on market opportunities with a strategy that has demonstrated impressive results over time.
- Risk Management
-
Our strategy incorporates sophisticated risk management techniques to protect your capital and minimize drawdowns. With built-in stop-loss mechanisms and position sizing algorithms, you can trade with confidence, knowing that your risk exposure is carefully managed.
- Fully Automated Execution
-
Take advantage of the benefits of automation with our strategy's fully automated execution. Say goodbye to emotional trading decisions and human error. Let the algorithm execute trades on your behalf, ensuring precise and timely entries and exits, even when you're away from your trading station.
Do not take yearly results too seriously.
Instead, focus on four or five-year averages.

Capture trends and achieve consistent results
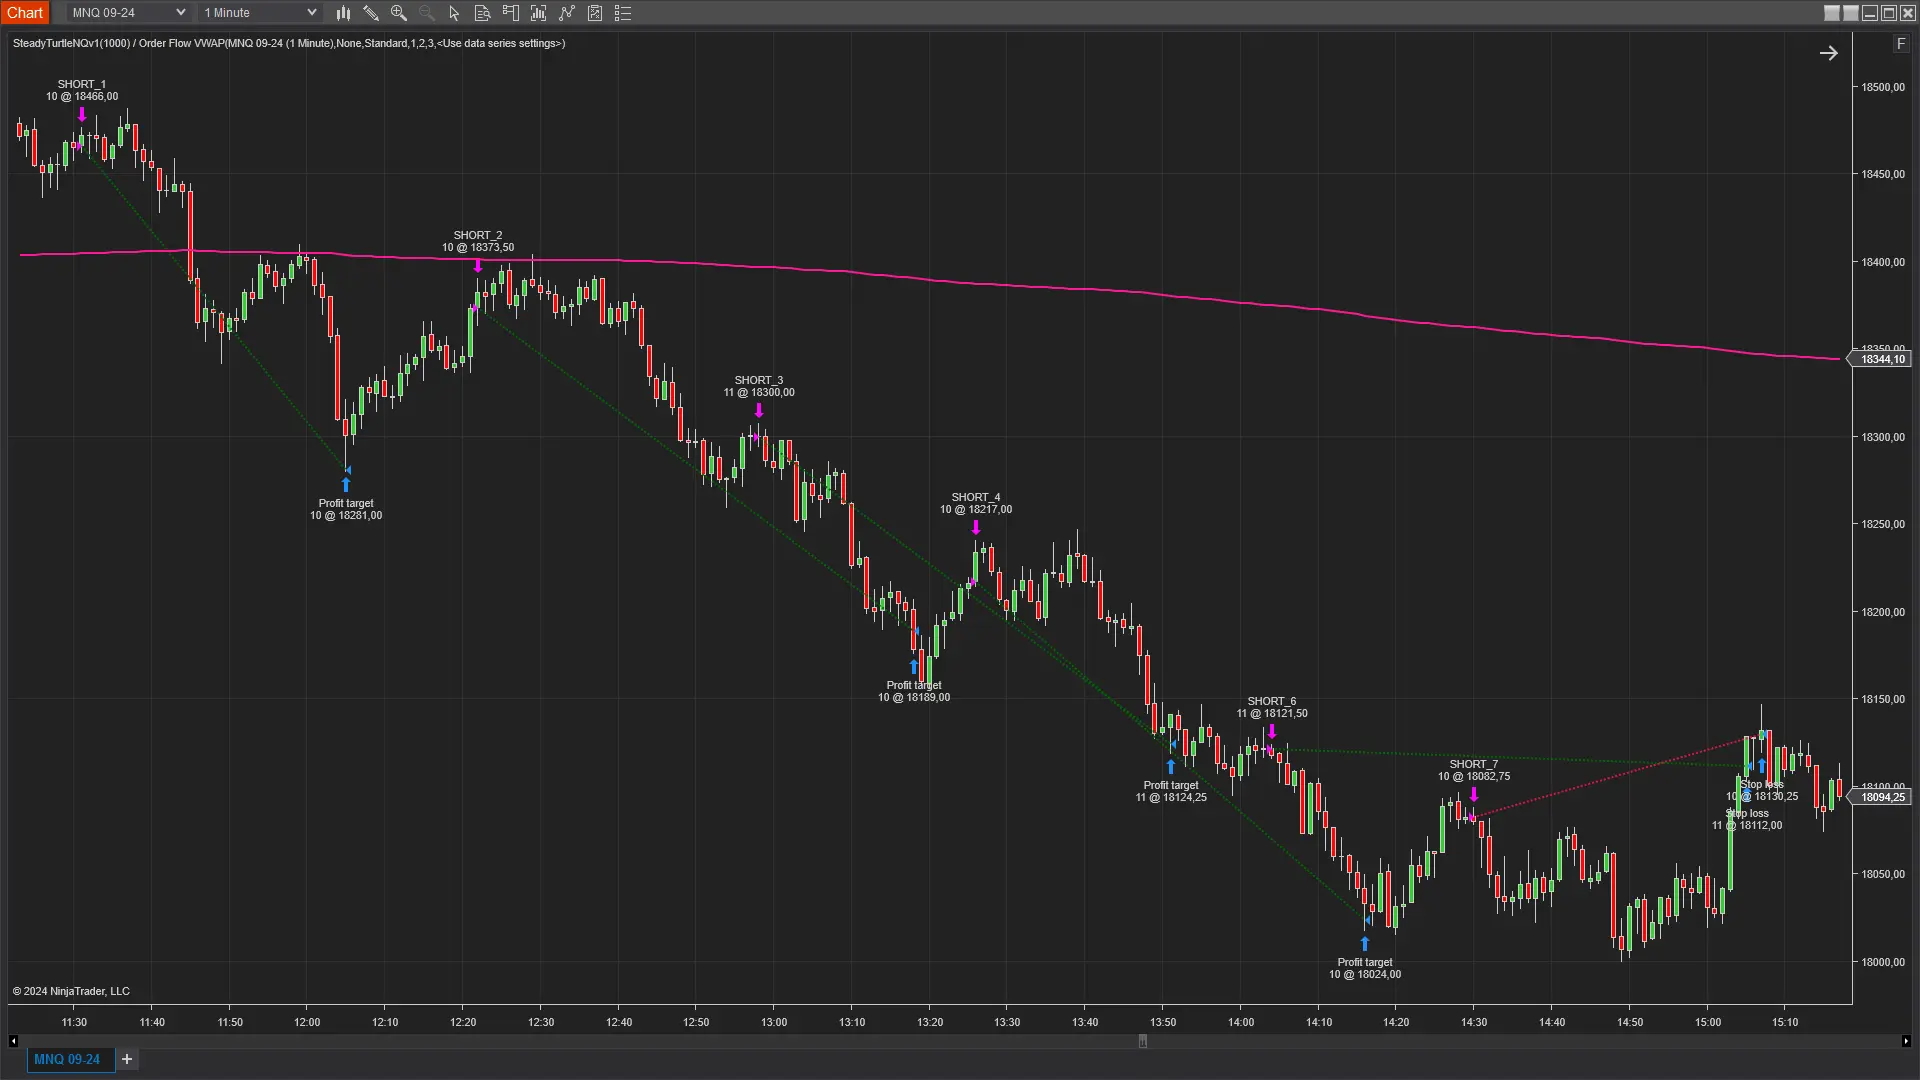
Pullback Precision
Pullback Precision is an automated trading strategy designed for NinjaTrader®, focused on capturing market trends and profiting from pullback opportunities. Combining real-time market analysis with automated execution, this strategy aims to enhance your trading performance by dynamically identifying key trend points and optimal entry positions during pullbacks. Ideal for futures traders seeking a robust, data-driven approach to achieve consistent results.
- Trend Following.
- Pullback Precision utilizes a robust trend-following approach, capitalizing on the overall market direction. By identifying market trends and using pullbacks as entry opportunities, we aim to enter trades at optimal points.
- Awareness of Divergences.
- While our primary focus is on trading NQ futures, we understand the importance of broader market dynamics. The strategy incorporates an awareness of divergences between the S&P and Nasdaq, leveraging this correlation to gain additional insights.
- Momentum & Volatility.
- Recognizing that each trading session is unique, the strategy adapts to current market conditions. We dynamically calculate stop levels and take-profit levels for each trade based on the prevailing momentum and volatility.
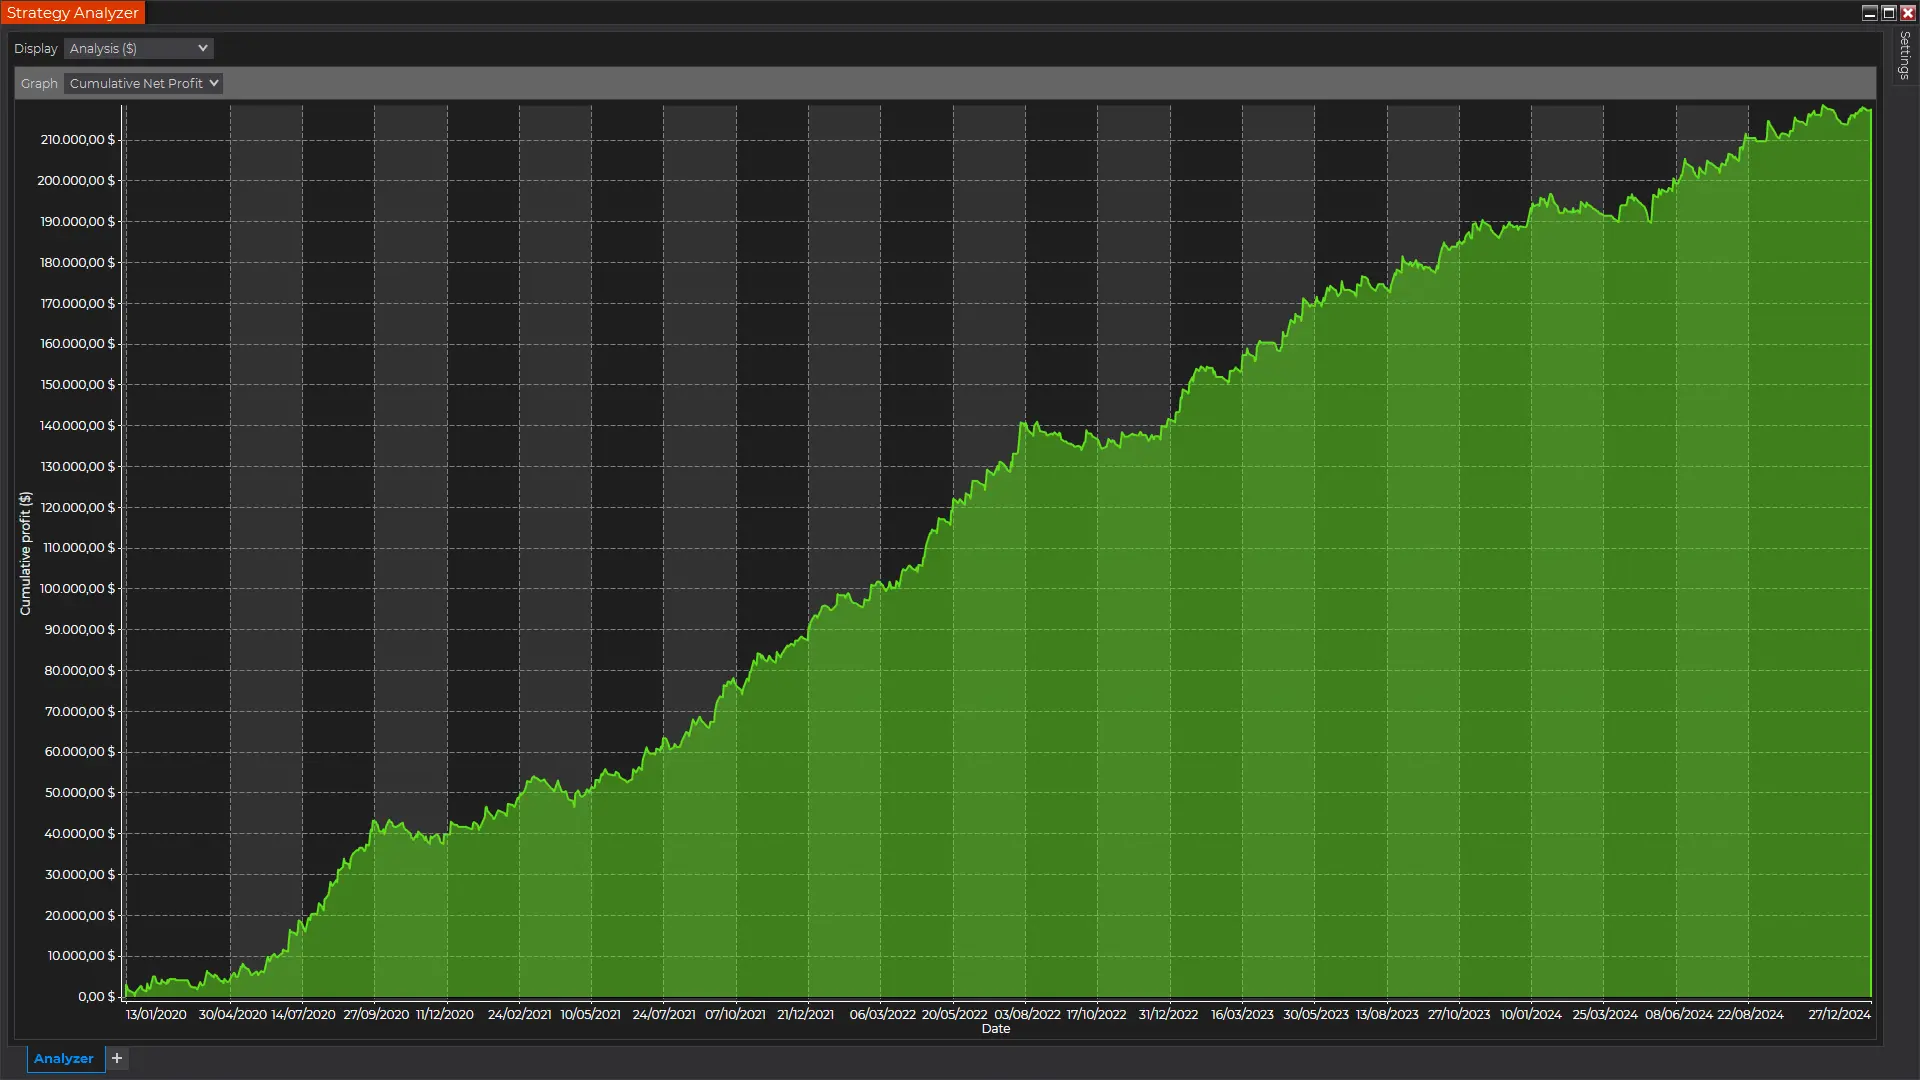
Track Record by Year
Unveiling Years of Consistent Trading
Statistics for 2020-2024 (Jan-Dec)
$25.000 Portfolio & $250 Risk per Trade
- Net Profit
- $ 217,548
- Performance
- 770%
- Avg. Monthly Return
- $ 3,663
- Maximum Drawdown
- $ 7,540
- Win Rate
- 23%
- Negative Months
- 11 / 60
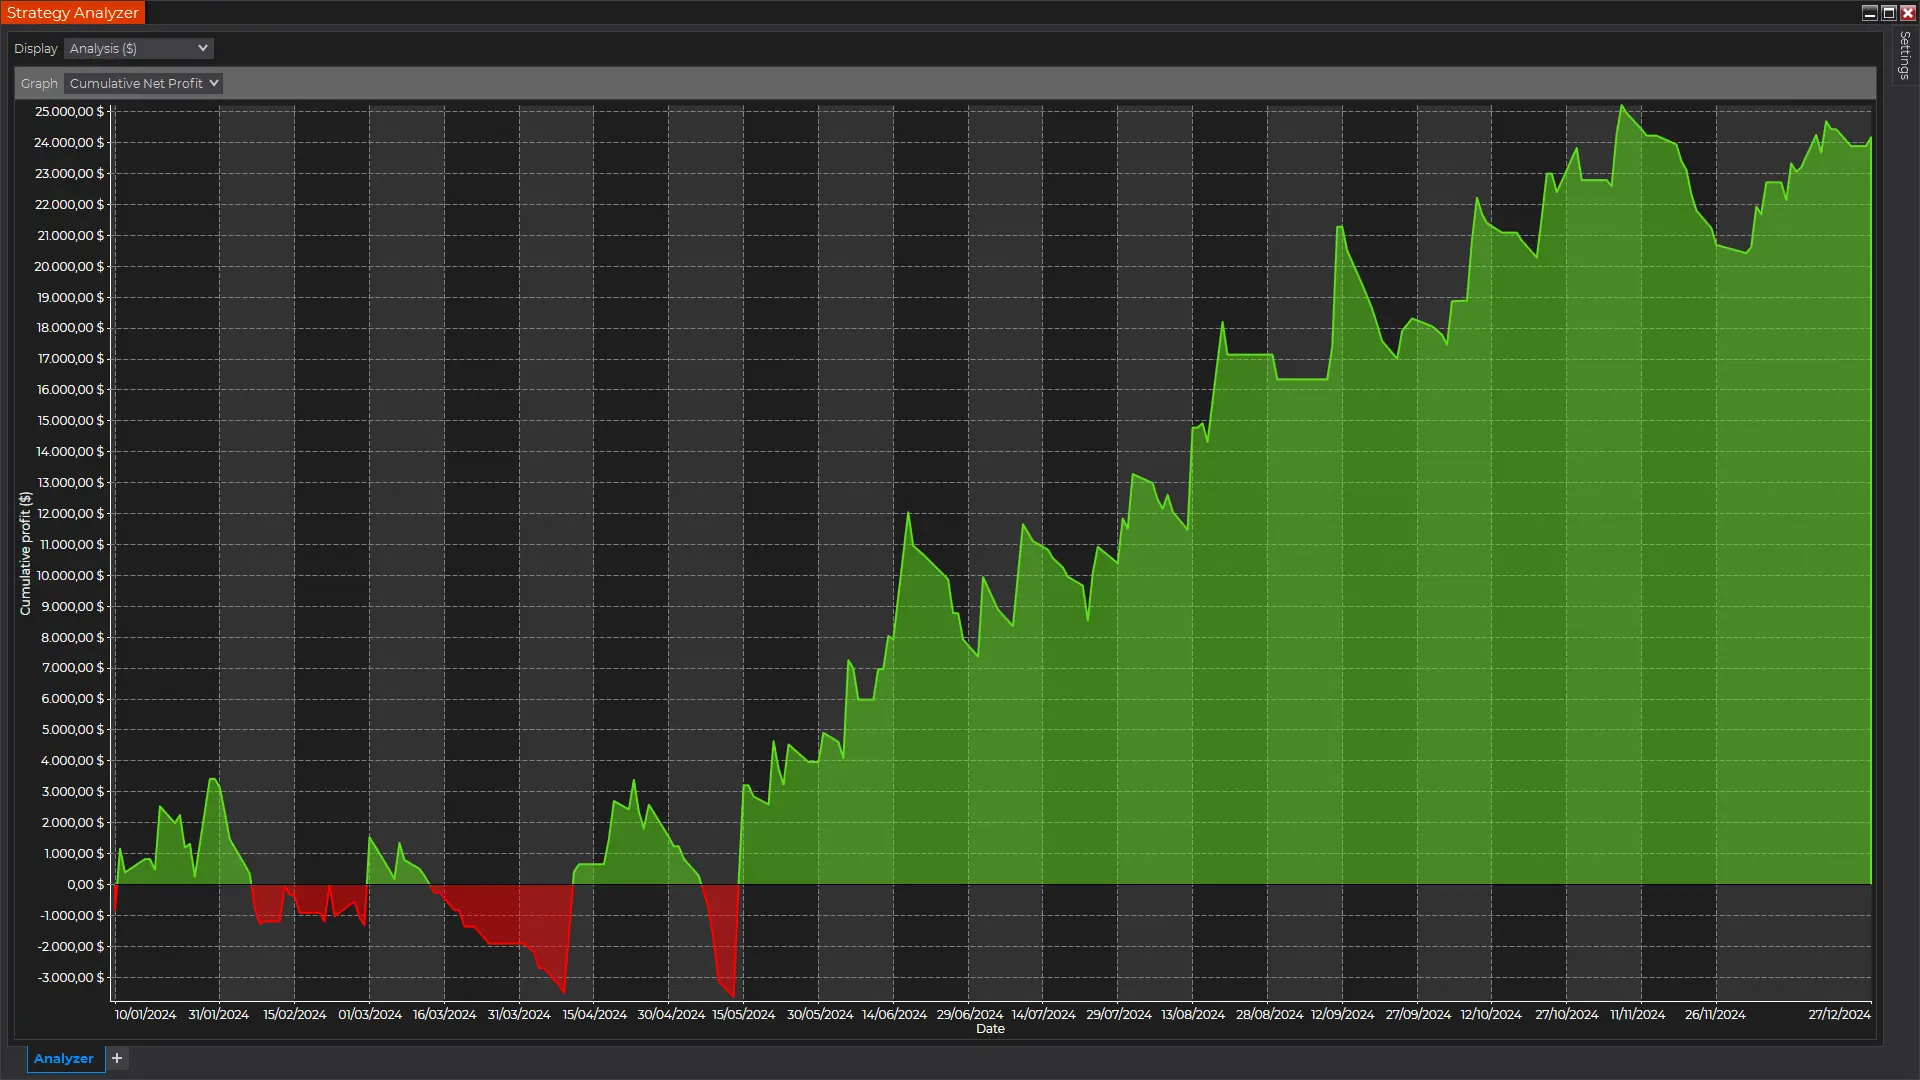
Statistics for 2024 (Jan-Dec)
$25.000 Portfolio & $250 Risk per Trade
- Net Profit
- $ 24,177
- Performance
- 96%
- Avg. Monthly Return
- $ 2,088
- Maximum Drawdown
- $ 7,343
- Win Rate
- 22%
- Negative Months
- 3 / 12
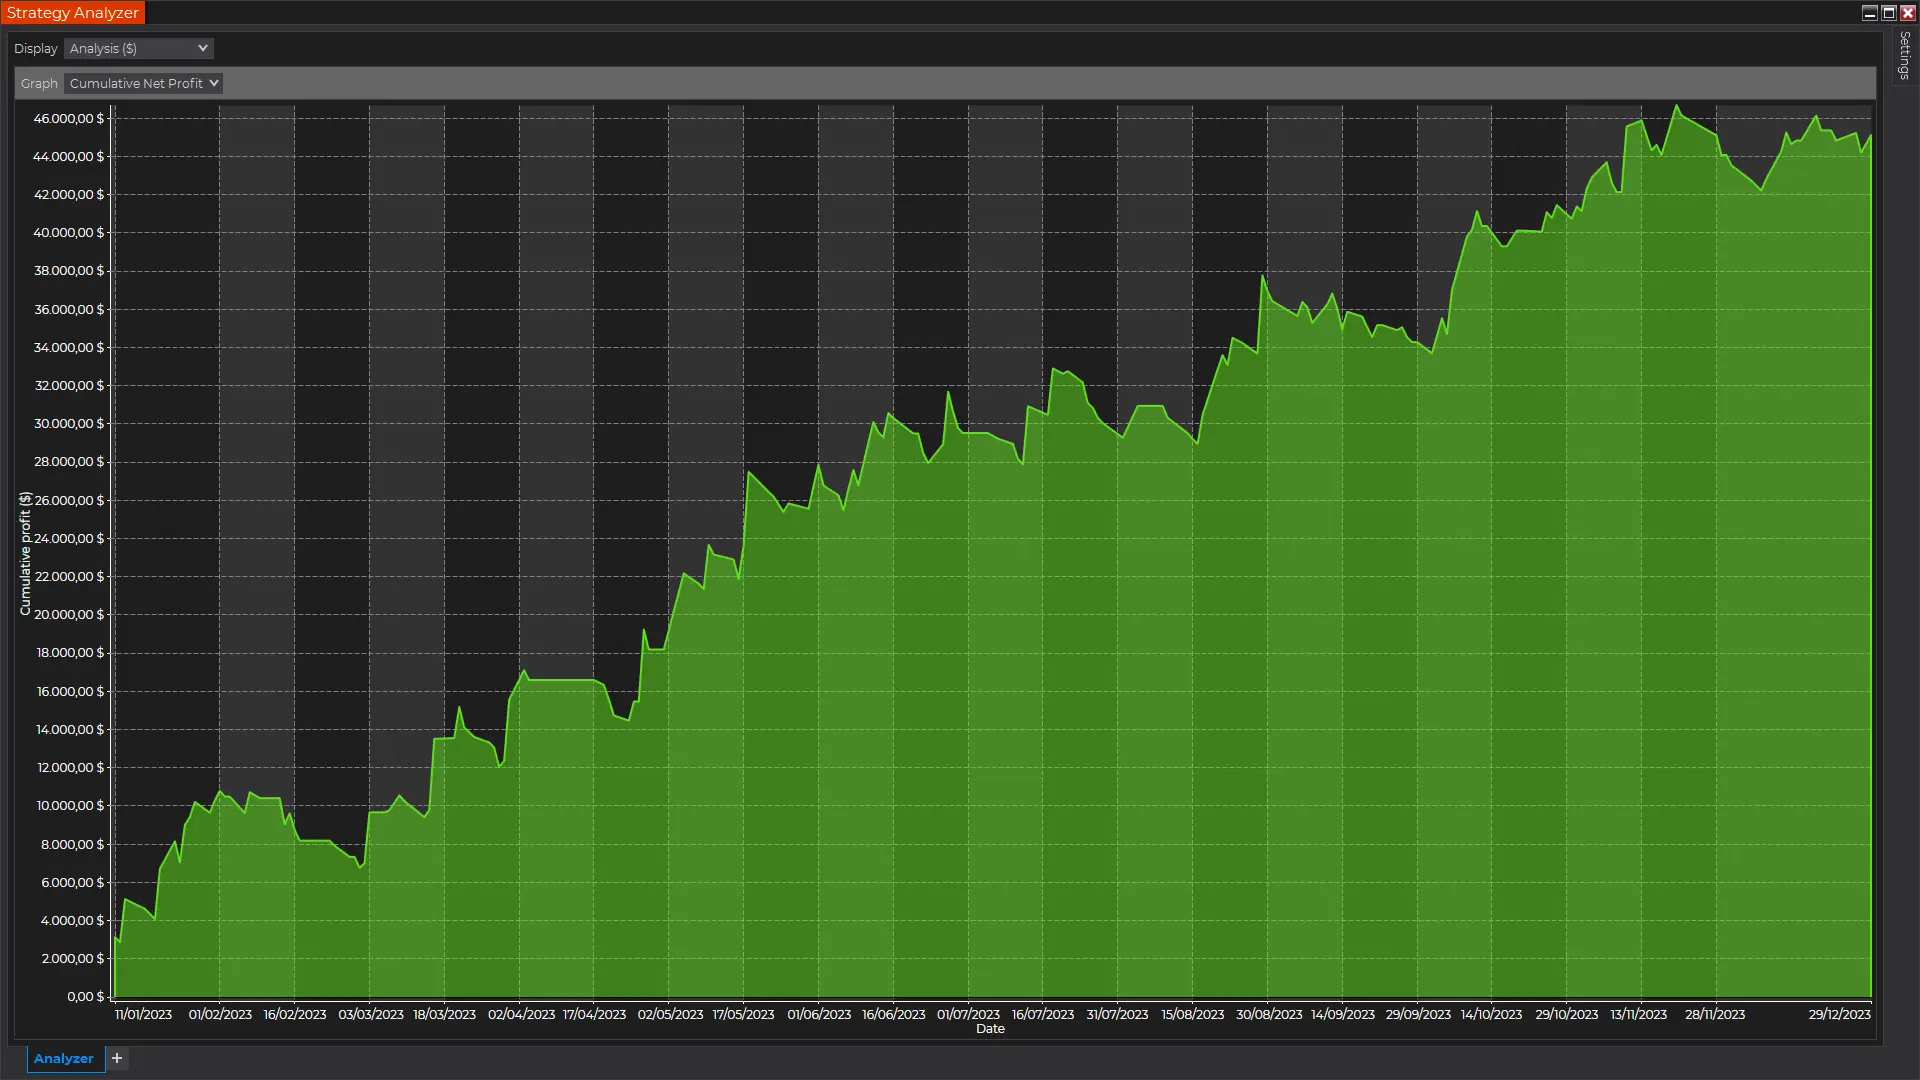
Statistics for 2023 (Jan-Dec)
$25.000 Portfolio & $250 Risk per Trade
- Net Profit
- $ 45,131
- Performance
- 180%
- Avg. Monthly Return
- $ 3,899
- Maximum Drawdown
- $ 5,016
- Win Rate
- 25%
- Negative Months
- 2 / 12
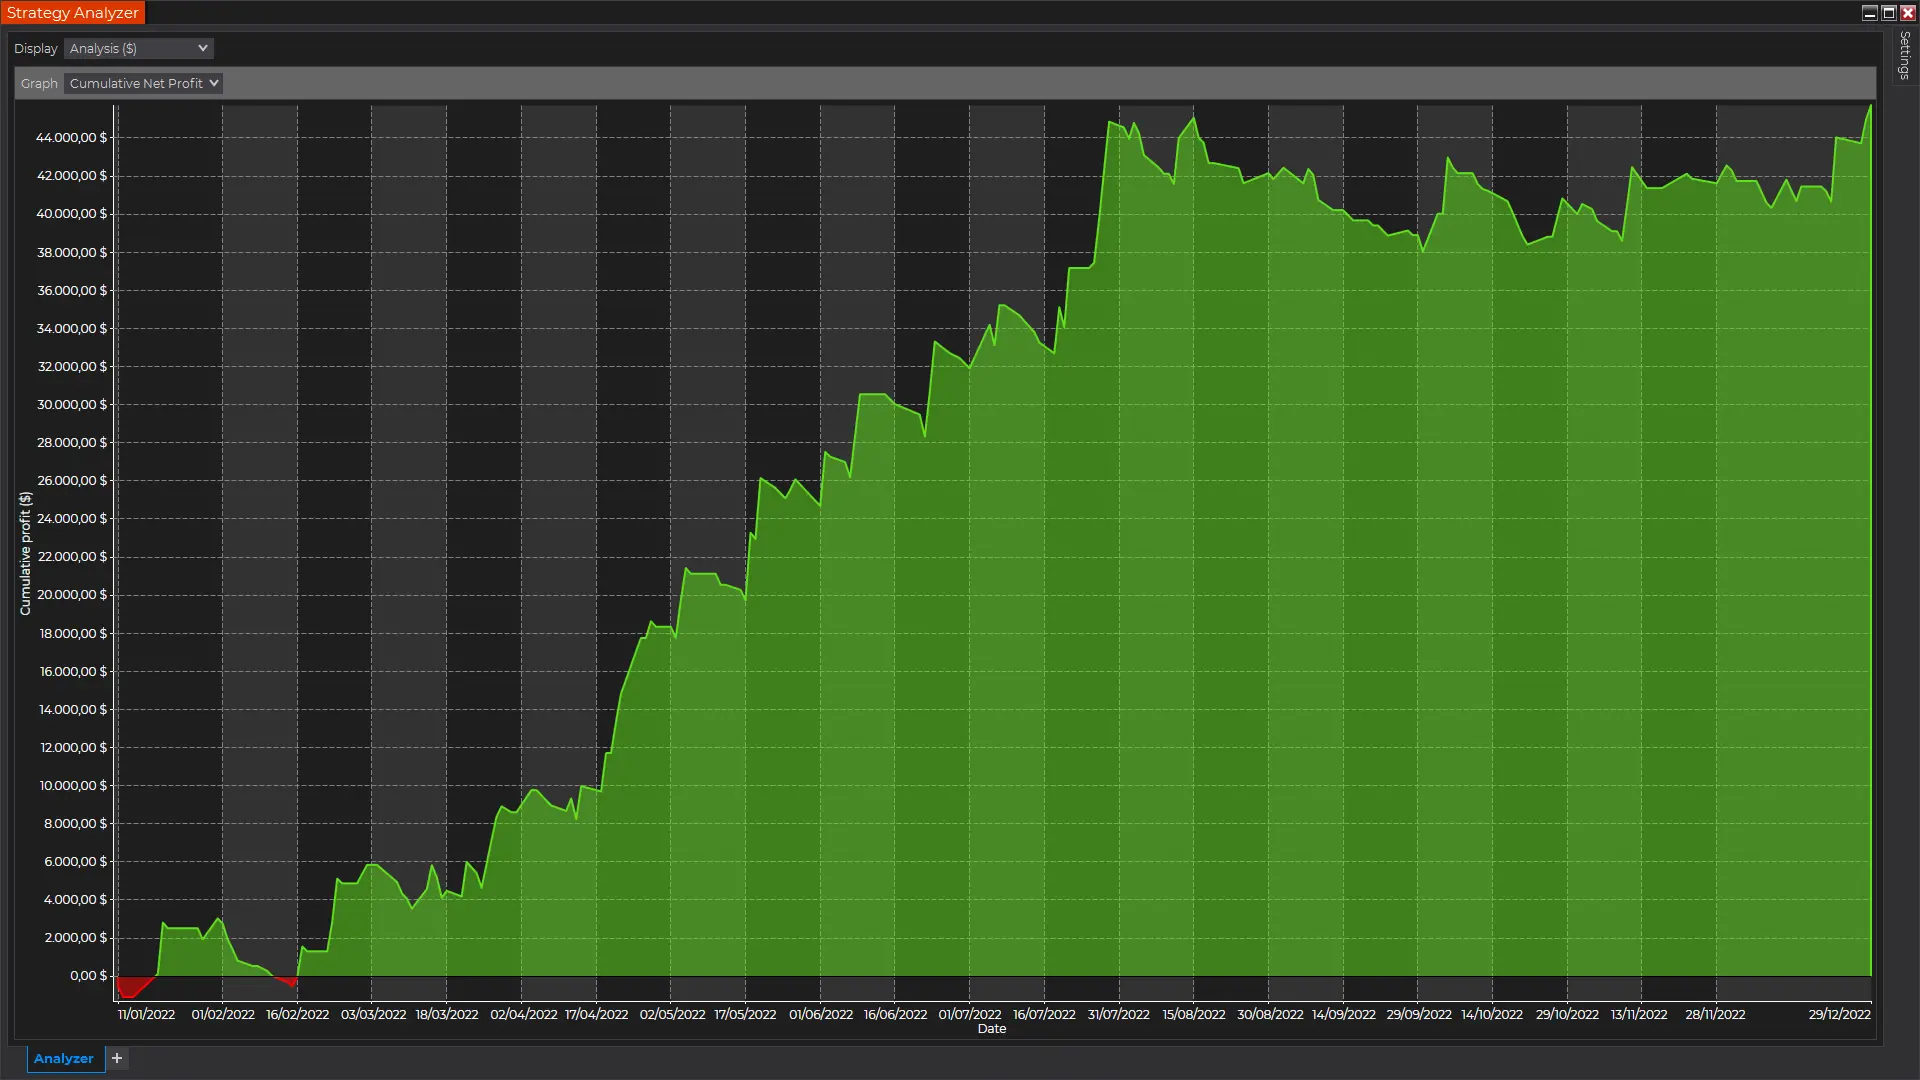
Statistics for 2022 (Jan-Dec)
$25.000 Portfolio & $250 Risk per Trade
- Net Profit
- $ 45,732
- Performance
- 182%
- Avg. Monthly Return
- $ 3,951
- Maximum Drawdown
- $ 7,391
- Win Rate
- 22%
- Negative Months
- 2 / 12
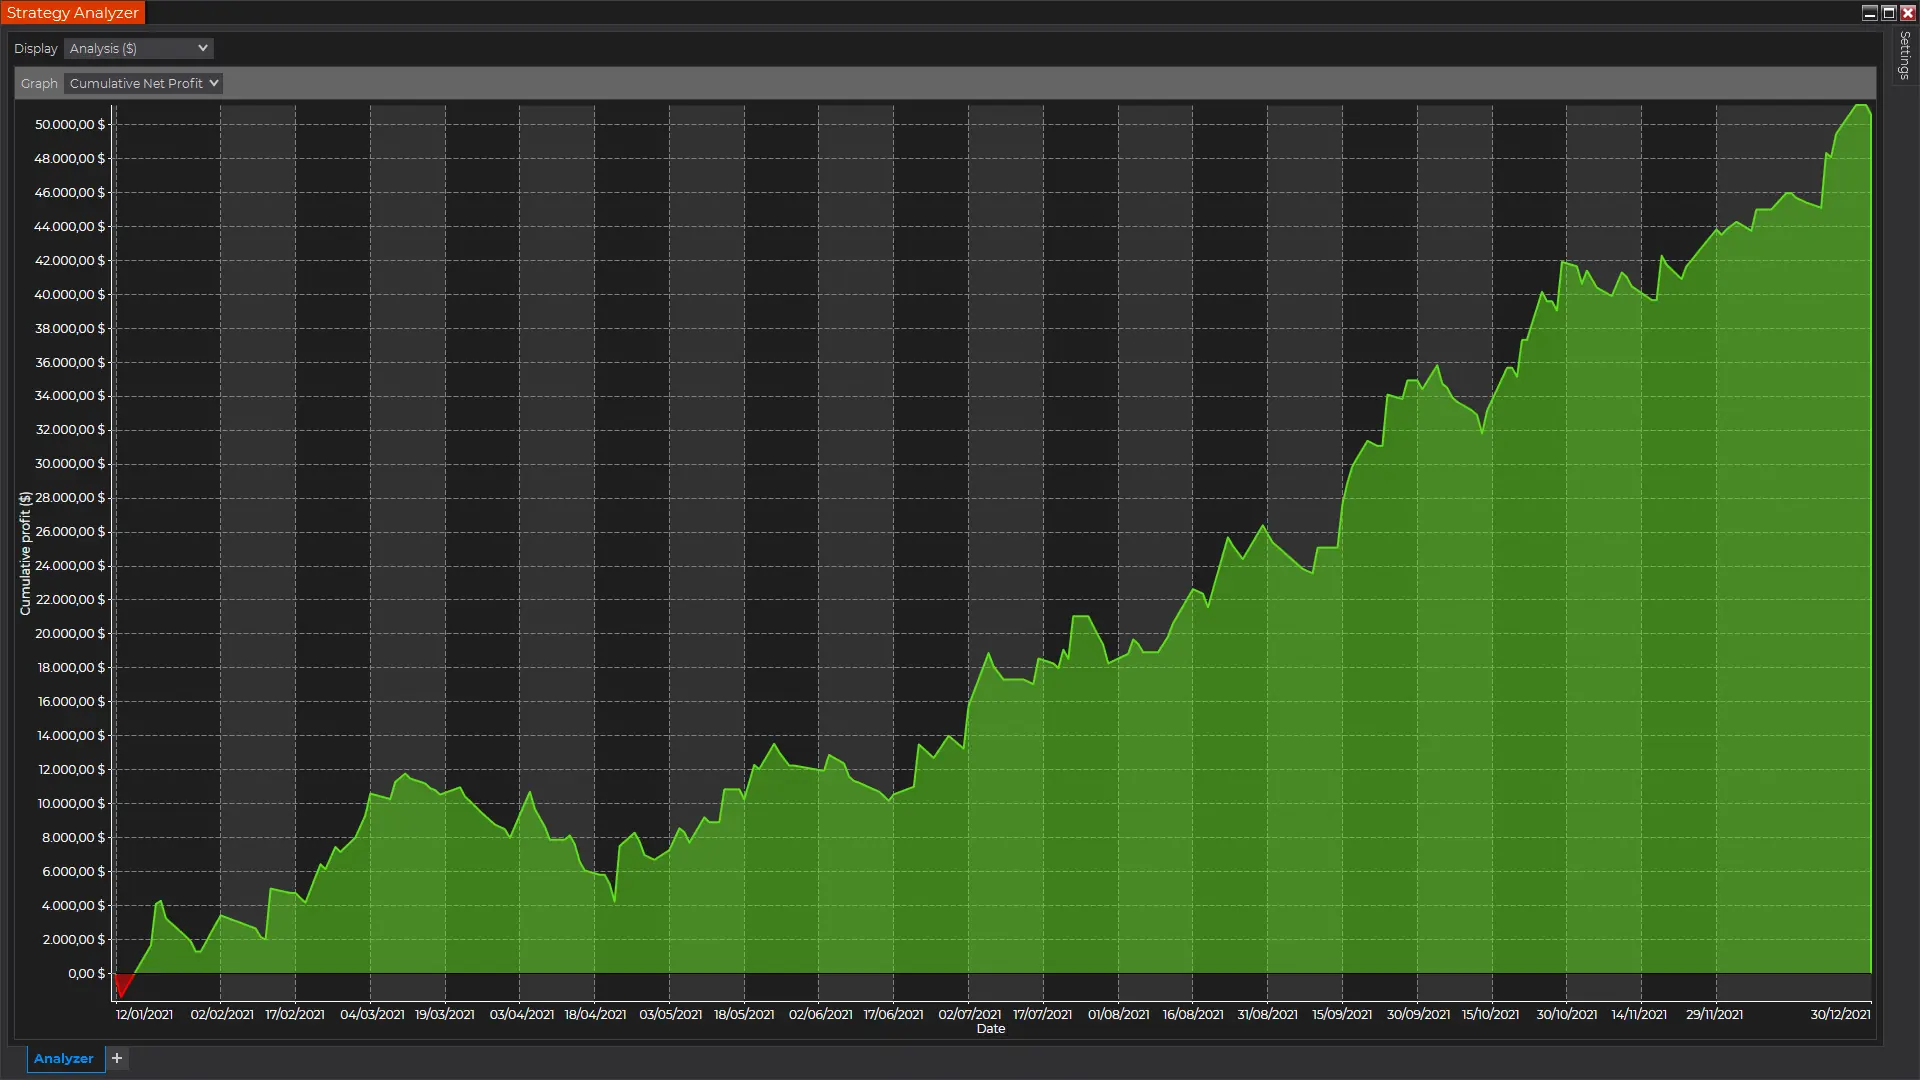
Statistics for 2021 (Jan-Dec)
$25.000 Portfolio & $250 Risk per Trade
- Net Profit
- $ 50,592
- Performance
- 202%
- Avg. Monthly Return
- $ 4,371
- Maximum Drawdown
- $ 7,540
- Win Rate
- 25%
- Negative Months
- 1 / 12
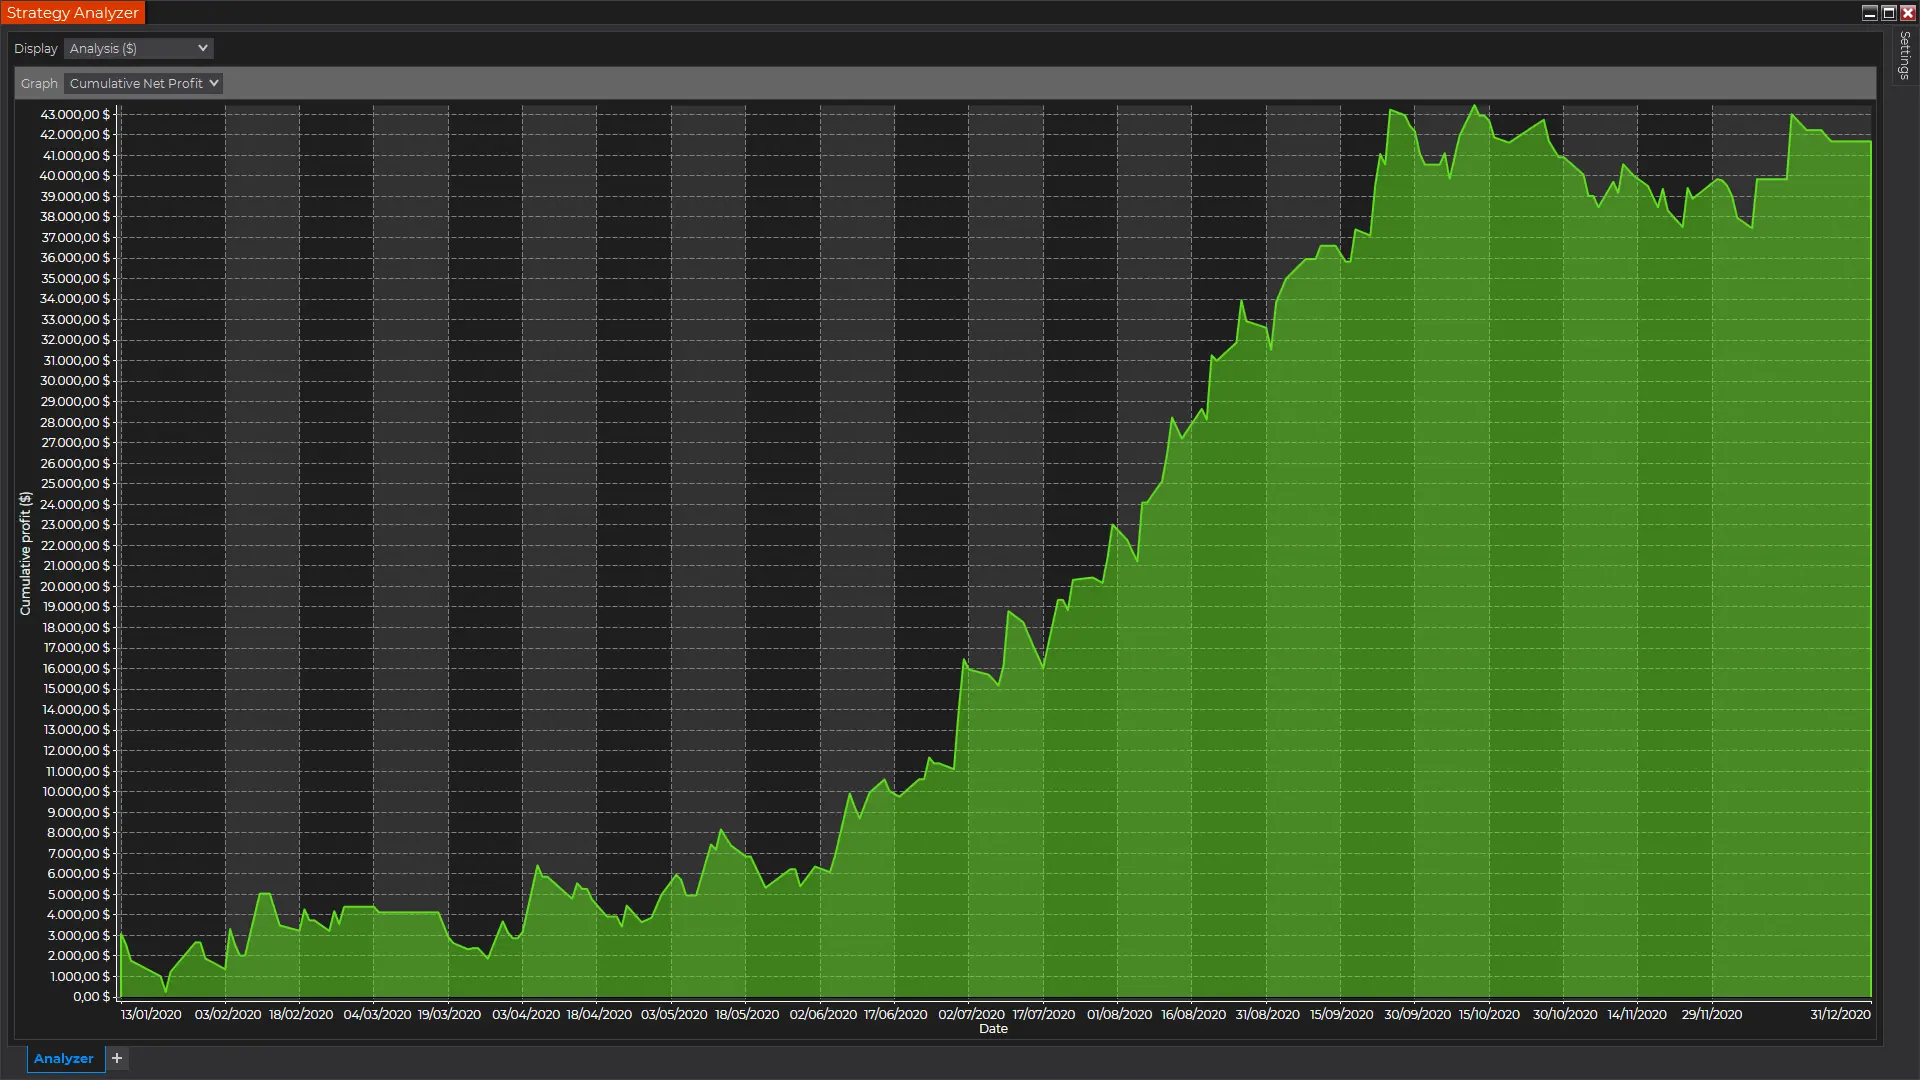
Statistics for 2020 (Jan-Dec)
$25.000 Portfolio & $250 Risk per Trade
- Net Profit
- $ 44,685
- Performance
- 178%
- Avg. Monthly Return
- $ 3,591
- Maximum Drawdown
- $ 6,194
- Win Rate
- 21%
- Negative Months
- 3 / 12
If you want to go even deeper here is a list of all trades taken for further analysis.
Download CSV"I had doubts initially, but once I committed to the strategy without obsessing over daily outcomes, I realized its true potential. Despite a lower win rate, the good days more than made up for it, and the results have been very satisfying."
"I've been running the Steady Turtle Strategy in parallel with my regular investing portfolio. Although it was tough to handle the initial 20% drawdown, I'm glad I stuck with it. So far, I've achieved a 50% performance in 2024. You definitely need to stomach the rough phases, but the long-term results have been worth it."
Pricing
Try Our Proven Trading Strategy Risk-Free!
Take the guesswork out of trading. Start with a 2-week trial at only $29, capped at a $100 max risk per trade to familiarize yourself with our software. Ready to commit? Choose from our packages designed for all skill levels — Starter, Experienced, or Professional. Plus, if your quarter ends negatively, we'll refund 100% of your subscription fee. Your success is our promise!
Starter
With a maximum risk of $100 per trade, you can navigate the markets with a controlled risk exposure while still participating.
- 1 Strategy
- 1 Installation
- $100 Maximum Risk
- 100% Money Back Guarantee
Experienced
With a maximum risk of $250 per trade, you can take advantage of favorable market opportunities while maintaining a balanced risk profile.
- 1 Strategy
- 1 Installation
- $250 Maximum Risk
- 100% Money Back Guarantee
Professional
With a risk of up to $500 per trade, you can take advantage of dynamic market conditions to enhance your profit potential.
- 1 Strategy
- 1 Installation
- $500 Maximum Risk
- 100% Money Back Guarantee
100% Money Back Guarantee
If the net profit over any 3 consecutive months is negative, you are eligible for a full refund of your subscription fees for those months. This guarantee applies only to active subscriptions maintained throughout the entire 3-month period. The results are based on a NinjaTrader backtest for that timeframe using the maximum risk setting of your chosen package. For example, if you subscribed on March 1st and the combined net profit from March, April, and May is negative, you'll receive a refund for those three months — no questions asked.
14-Day Trial: Get to Know the Strategy
Experience the strategy for 14 days with a capped risk of $100 per trade. This trial is designed to help you get familiar with the strategy, backtest it yourself, and see executions directly on the chart. Take this opportunity to explore how the strategy works, understand its behavior, and gain confidence before committing to a full subscription.
Frequently asked questions
Risk Disclosure
Futures and forex trading contains substantial risk and is not for every investor. An investor could potentially lose all or more than the initial investment. Risk capital is money that can be lost without jeopardizing ones’ financial security or life style. Only risk capital should be used for trading and only those with sufficient risk capital should consider trading. Past performance is not necessarily indicative offuture results.
Testimonials appearing on this website may not be representative of other clients or customers and is not a guarantee of future performance or success.
Hypothetical Performance Disclosure
Hypothetical performance results have many inherent limitations, some of which are described below. No representation is being made that any account will or is likely to achieve profits or losses similar to those shown; in fact, there are frequently sharp differences between hypothetical performance results and the actual results subsequently achieved by any particular trading program. One of the limitations of hypothetical performance results is that they are generally prepared with the benefit of hindsight. In addition, hypothetical trading does not involve financial risk, and no hypothetical trading record can completely account for the impact of financial risk of actual trading. for example, the ability to withstand losses or to adhere to a particular trading program in spite of trading losses are material points which can also adversely affect actual trading results. There are numerous other factors related to the markets in general or to the implementation of any specific trading program which cannot be fully accounted for in the preparation of hypothetical performance results and all which can adversely affect trading results.